Introducing the Paperless-ngx Plugin
Paperless-ngx Uploader for Thunderbird
I recently wrote an Add-On for Thunderbird to upload attachments directly to a Paperless-ngx instance.
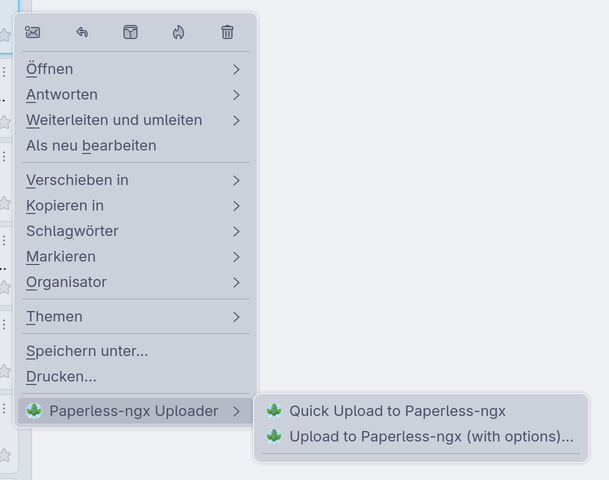
It adds an element to the right-click context menu to either just upload pdf-attachments without the need to give further metadata or open a dialog to enter metadata before uploading.
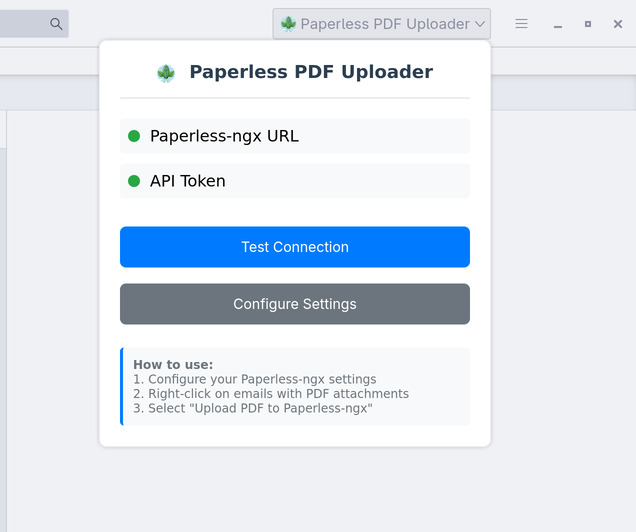
To see if the instance is available and the connection works, the Add-On also adds a popup UI to show the current status.